Wednesday, 7 December 2016

Marketing Measures That Matter

Chart of the Day: An example of the 'Critical few' KPIs

To coincide with the release of an enhancement to our RACE digital marketing dashboard, today's Chart of the Day isn't published research around digital marketing. Instead, it's what I think is a nice, practical example of achieving focus through a marketing dashboard:

An example of the measures / KPIs that matterThe visual dashboard above is a well-known dashboard example, taken from the well-regarded source of sharing approaches to managing Digital Business - the UK government's digital service.

Their article explains that when they're building a digital-by-default service like Carer’s Allowance, their team is continuously designing, testing and releasing changes to the live service to improve it and better meet user needs against critical KPIs of which standard usability measures like completion rate, user satisfaction and time to complete are most important.

They explain that, as a team, testing innovation they're moving away from detailed analytics reports to performance dashboards:

"Analytics reports have their place but they don’t help agile product teams make informed decisions while moving fast. We prioritise and release changes every 2 weeks and need to know quickly how the latest changes are performing.

Key metrics are data points that change over time depending on how well the service is meeting user needs. They relate directly to how easy, quick, or understandable the transaction is for users".

That's an approach to measurement and improvement which applies equally to commercial businesses and it certainly informs our approach to testing and use of dashboards for weekly and monthly reporting and review. In our main member's dashboard for Google Analytics  we have selected just 4 measures for each part of the RACE funnel from the many, many measures available in Google Analytics and channel measures for each are shown in a drill-down.


source http://www.smartinsights.com/goal-setting-evaluation/goals-kpis/marketing-measures-matter/

Introducing our RACE Google Analytics dashboard to help stay on top of your critical marketing KPIs

Use our new Digital Marketing metrics Google Docs reporting Spreadsheet to see your key marketing metrics at a glance

For Marketing, Digital marketing or ecommerce managers, the first week of the month is always a frantic one launching new campaigns, monthly dashboard reviews and on top of that you need to report the performance of your marketing to the internal stakeholders (the boss). Hopefully, it's a good news story, but if it isn’t, that just adds to the workload, identifying what went wrong and putting plans in place to turn things around.

This is where you need to practice the art of analytics, to quickly create a report or dashboard with a subset of key metrics covering all marketing activities in an easy to understand format for rapid review and recommendations for upcoming activities?

But how do you create a dashboard for reviewing digital marketing performance to compare different time periods such as monthly, weekly, quarterly or annually. While Google Analytics has many, many metrics and many many reports, consolidating them into the measures you need for a dashboard showing a marketing funnel can be a challenge. Sure, you can browse the Google analytics custom dashboard gallery, but you will find that many of these don't cover the 'full-funnel' needed for a strategy or business level review, instead they tend to focus on tools to help with tactics like SEO or social media.  You can also use a free or paid Google Analytics dashboard service based on the Google Analytics API which enables GA data to be loaded into a dashboard in real time with the appropriate permissions. The challenge is, there are over 60 in Google's list of providers...

But if you don't want to use a third-party option and pay the ongoing cost, there is another option. This is where the free Google Analytics API and the Google Analytics Sheets add-on for Google Docs can help. Many businesses use Google Sheets for reporting already, but it does require a certain knowledge to set up, so we have provided a pre-built dashboard for Expert members to explain how it works and as a starter for you to create further dashboards. In the post we will explain the 9 steps needed to configure the GA Sheets add-on. We've described it for our Google Sheet format, but any similar dashboard will use this approach to connect to Google Analytics and pull the data.  

The Smart Insights RACE Digital Marketing dashboard

The purpose of the Smart Insights dashboard is to help managers to complete a regular weekly or monthly review of the current effectiveness of their digital marketing using Google Analytics with Google Docs Spreadsheets. We use this combination ourselves in our monthly reporting! The dashboard makes it easy to compare digital marketing performance through time with a focus on the key digital marketing measures across the customer lifecycle or marketing funnel defined across the Smart Insights RACE planning framework. For example, you can compare year-on-year or compared to the previous reporting period.

race-digital-marketing-dashboard

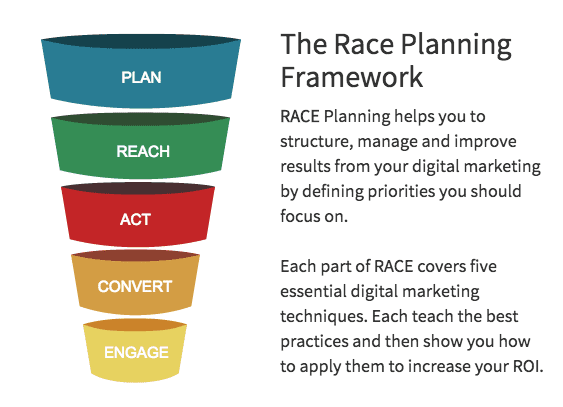
The Smart Insights RACE framework used in all our member resources was developed to help digital marketers plan and manage their activities in a more structured way since we found that many don't have a digital marketing strategy with clear objectives and KPIs (key performance indicators).

By reporting on just four metrics for each of the Reach, Act, Convert & Engage parts of the funnel you can measure the key areas of your digital marketing plan to see which are working or require attention. In addition to overall visits, leads and conversion, the dashboard also includes key low-cost channels used by many businesses of organic search, social media and email marketing.

The 2nd tab in the sheet then provides a more detailed channel dashboard which provides more in-depth data across all the different channels driving traffic to your site.

smartinsights-google-analytics-dashboard

How to use the RACE analytics dashboard or similar Google Spreadsheets based on the GA API

What you will need:

  1. A Google account to open and make a copy of the spreadsheet
  2. The Google Analytics spreadsheet add-on within Google Spreadsheets click here
  3. A Google Analytics account
  4. Your Google Analytics ID

How to get the dashboard

Smart Insights Expert members can download the Google Analytics Digital Marketing Dashboard here. We share these instructions since they also apply if you were creating your own similar dashboard

1. NB. Ensure you use the same Google Account for Google Analytics and Google Sheets.

2. Make a copy of this Report - you do this from the "File" menu of Google Sheets > "Make a copy" option

When you first open you will see a blue box, top left, saying the spreadsheet is 'Read-only'

2016-09-26_10-16-02

The first thing you should do is to 'Make a copy' via the file menu, which you use for your internal use.

2016-09-26_10-14-28

3. Install the Google Analytics Add-on for Google Sheets - Add-ons > Get add-ons in the Sheets menu.

This is how it will look once it is set up. When you first look, Google Analytics won't be there so you will have to add it using the 'Get add-ons' option.

2016-09-26_10-13-04

Choose 'Get add-ons' and then search for Google Analytics - you want this one which offers to 'Access all of your Google Analytics data in Google Spreadsheets' - it's available from Google.

2016-09-26_10-10-14

When you click on it you will see these details.

2016-09-26_10-10-44

Next click the + Free button and it will be available.

Next, the hardest part which is to find your Google Analytics 'View ID'

4. Place your Google Analytics View ID on Cell B3, Tab "++Configure Report++"

5. Find your GA View ID in analytics to customise it to your business
- Sign-in to your Analytics account.
- Select the Admin tab.

2016-09-23_16-26-56

- Select an account from the dropdown in the ACCOUNT column.
- Select a property from the dropdown in the PROPERTY column.
- Under View , click View Settings"
2016-09-23_16-28-486. Place your Google Analytics View ID on Cell B3, Tab "++Data Parameters++"

configure-dashboard

7. To calculate and display 'Leads' & 'Sales', identify which GA Goals are most relevant to you in your view and replace the goal numbers "ga:goal1Completions' (for Act conversion goal) and "ga:goal2Completions' (for Convert goal) in Tab "Report Configuration" Cell B8, C8, D8 & E8

You can find out the Goal numbers by clicking on the Admin tab we mentioned at step 5 and by then clicking on the Goals option under view.

2016-09-26_10-35-35

8. Add your reporting dates to Cells B6, B7, B10 & B11.

For example to compare two consecutive months or year on year changes.

You can see an example of this in Step 6 above where we are comparing two months.

9. Now you are ready to run your first report in the Sheets menu! Simply select "Add-ons" on the Google Sheet > "Google Analytics" > "Run Reports"

2016-09-26_10-40-11

Congratulations - The example data on 'RACE dashboard' sheet should now be updated. If not, carefully check each of the steps above.

Once set up the whole process is more straightforward if you are simply using one Google View / Account. You will just need to repeat steps 8 and 9.

But is my information secure?

A vital question to ask! The answer is... Yes! This dashboard is built using the popular online Google Docs Spreadsheet Sheets to report on business marketing performance using Google Analytics data from your Google Account via the Google Analytics API. This data is only available to those in your business who can sign in with their username and password to have access to the account and know the ID of the website property and view. It is not available to Smart Insights or anyone who doesn't have this information since the same Google Analytics and Google Docs account must be used.


source http://www.smartinsights.com/goal-setting-evaluation/web-analytics-strategy/introducing-race-analytics-dashboard-help-stay-top-critical-marketing-kpis/

Essential Retail Innovation Stats for Planning 2017

Key Findings from a survey of 500 European fashion retailers

Retailers are undoubtedly enthusiastic about innovation, with more than half viewing it as a priority for their business. But when it comes to actually delivering innovation, retailers face a variety of challenges.

To find out how retailers are approaching innovation in 2017 and beyond, we surveyed 500 retailers from across Europe. Here, in a summary of our full report, we share five key findings.

9 in 10 retailers take innovation seriously

Almost all retailers surveyed recognise the value of innovation, highlighting the growing importance of innovating in order to stay ahead in an increasingly competitive market. UK retailers in particular, place great emphasis on innovation, with 76% of respondents saying that it is a priority for their business.

importance-of-innovation-to-retail-companies

A lack of time is the #1 barrier to innovation

Fashion retailers cite several barriers to innovation, including a lack of time or resources (43%), lack of investment (40%) and integration issues (39%). Not having a clear vision or strategy is also holding many retailers back.

Only 15% of retailers have a dedicated role for innovation

A myriad of roles are said to hold responsibility for innovation, with CEO/MD coming at the top with 24%, followed by CMO (18%), CDO (16%) and chief customer/experience officer (11%). Fifteen percent of retailers claim that innovation is embedded into all teams.

Fewer than 50% of retailers have a defined process for innovation

Currently, only 4 in 10 retailers report having a defined process for innovation, but almost half claim they are planning to implement one within a year. Those retailers with an annual turnover exceeding £500m are by far the most likely to already have a process in place (73%).

27% of retailers consider positive media attention a KPI for their innovation programmes

Positive media coverage is most important to Belgian (41%) and German (37%) retailers, which is not surprising given the fact that a quarter of German retailers view innovation as a buzzword (versus 8% of all retailers surveyed) and may therefore be driving “innovation” purely for the positive PR it can bring.

Retailers are primarily interested in customer satisfaction as a measure of the success of the innovation programme (45%), followed by increased revenue (44%) and number of newly attained customers (42%).

top-kpis-for-assessing-innovation-strategy

Read the full report

This is a summary from a full research report, the result of interviews with 500 retailers across Europe on how they are delivering on the fundamentals of retail versus how they are approaching innovation. Click here to download the full report.


source http://www.smartinsights.com/managing-digital-marketing/marketing-innovation/essential-retail-innovation-stats-planning-2017/

10 Classic Digital Marketing Models

Digital marketing models to provide useful frameworks for digital audits, planning and strategy

If you are a marketing manager needing to create a digital marketing plan or conduct an audit or review online communications, models provide a helpful flow as to what to include and to ensure nothing is missed.

Previously, in 2013, we created a free guide to support students using models in their assignments or when creating plans: Essential Marketing Models and based on feedback from studying professionals and their lecturers thought it would be useful to have a specific guide to Digital Marketing Models.

In considering what to include we explored digital audit tools, digital planning frameworks as well as digital strategy models. We arrived at a list of ten, although we think we will add to this – hopefully based on your feedback!

Digital marketing models table

Some of the classic digital marketing models like Hofacker’s 5 stages of information processing, are a little dated, but still relevant. Others like the Technology Acceptance Model are longer established and popular with PhD researchers (which is how I came across this) and others such as The Honeycomb model are newer and also research-based and this model was created by a group of professors to unravel social media platforms.

Let’s look at each digital marketing model. Our Digital Marketing Models guide provides more details and explains how you can use it, with examples and templates to use in your organisation.

Forrester’s 5Is

This looks at the level of involvement, interaction, intimacy, and influence an individual has with a brand over time.

Lauterborn’s 4Cs

This is an updated version of the 4Ps focused on the customer which is useful for an internal audit as well as competitor comparison. We mentioned this on an earlier blog post when developing the digital marketing models guide.

Ten C’s of marketing

This is a popular framework with students and has been discussed on Smart Insights before. The 10 Cs provides a framework to review internal and external online marketing activities.

6Cs of customer motivation

Originally created by Dave Chaffey, this is a useful marketing planning and online customer communications model for developing your website or online community.

Hofacker’s 5 Stages of information processing

Charles Hofacker is an American Professor of Marketing and still an active researcher today. Although both Dave and I remember his book from 2000 (which explained how to use internet browsers!), this is still a useful framework to use when building online communities, planning web development, creating online adverts and / or developing online customer comms.

RACE Planning

As a Smart Insights member, you may be familiar with RACETM Planning which is a system developed by Smart Insights to help marketers to develop digital marketing plans focused on sales growth. It is a very popular digital marketing model and we have full article explaining RACE Planning and KPIs.

RACE planning framework

Technology Acceptance Model

Originally created in 1989, but since extended by most PhD students, this model can be used to test adoption of new technology based on positive attitudes towards client benefit and user experience.

4Cs for marketing communications

Another framework we reviewed on an earlier post (don't confuse the 4Cs with the 4Cs!) this is a useful marketing strategy model for developing your Online Value Proposition (OVP).

McKinsey's consumer decision journey

The major US consulting firm develop various models and this digital framework reviews the online customer journey from consideration to purchase. Danyl Bosomworth has talked about this on an earlier post.

The Honeycomb Model

Based on work from a group of Canadian professors, the honeycomb model is a framework to define social media usage for organisations.

If you think there are missing models or if there is a digital marketing tool we should have included, please do let us know and we will add to the next edition.


source http://www.smartinsights.com/marketing-planning/marketing-models/digital-marketing-models/

Tuesday, 6 December 2016

What are the main barriers to online conversion?

Over half of customers prefer to buy from a site using guest checkout

In our latest Chart of the Day, we find that research by Worldpay suggests there are several key barriers to cart abandonment, including lack of guest checkout and lack of delivery option available.

It's the most important thing anyone in E-commerce or digital marketing can focus on: how to cut abandonment rates and increase conversions. As digital marketers ourselves it's something we're working on everyday.

online-check-out-statistics

The research found that:

  • Over half prefer guest checkout
  • Over half would abandon their cart if they cannot get the delivery option they want
  • Almost 7 in 10 customers aged between 18 and 35 are more likely to purchase on their mobile phones
  • Over half of customers are positive about one click purchasing
  • Nearly 4 in 10 think paying online is too slow

what-makes-customers-abandon-online-purchase

The research also found that most customers abandon because they have to create an online account to complete the purchase.


source http://www.smartinsights.com/conversion-optimisation/main-barriers-online-conversion/

Raise your Ecommerce Conversion Rate with Online Chat

How and Where to Add Chat To Your Website

I’ll start with a simple question: Are you actively interacting with visitors to your store? If you own a physical store, your answer is probably ‘Yes’. But if you operate a virtual storefront - a website - and you’re answering ‘No’ to this question, you’re leaving a lot of visitor questions unanswered. And since people who don’t get their questions answered are less confident and engaged shoppers, they’re more likely to leave your website. And too many bailouts will kill your conversion rate.

Picture yourself in shopping mode: even if you know exactly what you want, and from which stores you’d consider buying it, you usually have at least one lingering question. For example, if you’re shopping for shoes online, you might not be sure if the website you’re visiting offers black suede shoes in your size. Or you might wonder if they can deliver shoes to your doorstep within two days, and if they offer free returns. If you don’t get these answers within a minute or so you’ll leave the site and visit another shoe seller who cares enough to address them.

So, how can you create this essential dialog? It’s as simple as adding online chat to your website. Already have chat? That’s great! It’s likely, though, that your chat user experience isn’t as good as it needs to be to fully satisfy your visitors. Haven’t plugged in chat at all? No problem, many cost-effective chat tools have appeared on the market in recent years, so it’s a great time to choose a vendor and start chatting.

I’ll get to chat tool specifics in a minute. But first, let me cover a few chat facts.

Why you need to use live chat

Visitors who chat convert at roughly 8 times the rate of non-chatting customers. How do I know this? Well, based on consulting I’ve done for 30+ ecommerce clients who sell everything from auto parts to surveillance equipment to traffic school, I know that overall conversion rates for unassisted sales of discretionary products are typically in the 1.4 to 1.8% range. And, based on discussions with customer service team managers, I know that conversion rates for chat-assisted sales are in the 15 to 20% range. This is where I get the 8X factor (on the low end).

I also know that visitors who have been helped by a knowledgeable rep who has a pleasing, caring personality, are more likely to return to a website and buy in the future. In other words, the effective conversion rate for returning visitors who participate in chat is even higher - more like 25%. That is a 14X chat-assisted conversion multiple! So, if you want to turbo-charge your funnel conversions, you’ve got to get chat installed soon.

What to do If You Already Have Chat

If you already have a chat app installed, you need to optimize it, in this order:

  1. Improve the chat User Experience (UX)
  2. Make your chat support more visible
  3. Hire and train more support reps
  4. Train your staff reps in sales and service best practices

Improve your chat UX from both the inside and from the outside. Improve it from the outside by tapping an existing designer, or UX consultant, to configure the chat layer user experience so that it’s most appealing. Consider adding an image of a friendly customer service rep (it doesn’t have be your rep, but he or she shouldn’t look like a stock model). Consider requiring an email address for visitors to initiate chats. I used to consider this a no-no, but it’s more common nowadays, and of course ensure that you’ll be able to follow up with ‘warmer’ prospects.

livechat

Once you’ve done this you should make your chat more visible. In addition to adding a ‘chat’ link to the top right corner of your website’s header area, you should:

  • Add a chat link near the ‘add to cart’ button on the Product page;
  • Add a prominent chat link on your Cart and Checkout pages;
  • Push chat invites to visitors who haven’t interacted with a page deep in your funnel (product page, cart page, shipping page) within a specified number of seconds;

Keep in mind: while people visiting your website can perceive most of your page, their visual focus area is only the width of two thumbnails (when you hold your arms extended). So the chat link needs to be ‘duh’ obvious for it to be seen by most visitors.

Regarding training, Dale Carnegie offers customer service training modules starting at just $99 per student. A few of their core training courses, coupled with your internal sales training should do the trick. If you’re willing to invest more, check out Zappos.com’s ‘School of Wow’ training, which is held onsite in the Las Vegas area.

What to Do if You Don’t Yet Have Chat

Don’t have chat yet? If this is the case, your first order of business is to research and select a chat tool. After you’ve decided on a tool you’ll need to:

  1. Integrate the chat tool with your website backend and customer service application
  2. Add a chat link to your site header (for starters)
  3. Hire some chat (or hybrid phone/chat) support staff
  4. Train your staff reps in sales and service best practices
  5. Continue with the above chat optimization steps

While I don’t endorse any particular chat tools, the Freshdesk, BoldChat and SnapEngage tools are good overall. If you’re on a really tight budget or are seeking a chat tool that’s part of an all-in-one visitor analytics suite, check out the basic chat tool built into the LuckyOrange suite.

To staff your chat, be pragmatic. You don’t necessarily have to hire chat-dedicated reps as you are ramping up this customer contact mode. Cross-train a few of your phone reps (ones who can type reasonably well) on how to do chat support. And give them extra love, training and support, because you’ll find these flexible ‘hybrid’ reps are worth their weight in gold.

Don’t dally! Give yourself 45 days at most to finish your research and get a tool plugged in. And don’t worry if you don’t have the perfect tool for your initial launch. Just makes sure it integrates with your customer support service so that you can collect a log of visitor discussions over time, and you can do things like push populated carts to more engaged chatters, and save chat discussions to the prospect’s profile (associated with their email address).

Chatbots, uh, what?

There’s a new chat game coming to town that I wanted to make you aware of - chatbots. What the heck is a chatbot? A chatbot is a service, powered by rules and sometimes artificial intelligence, that you interact with via a chat interface. The service could be any number of things, ranging from functional to fun, and it could live in any chat product (Facebook Messenger, Slack, Text Messages, etc.).

chatbots

Two kinds of chatbots exist now: bots based on a set of strict rules, and others based more on flexible machine learning. Rules-based bots are very limited. They can only respond to very specific commands. If you say the wrong thing, it doesn’t know what you mean. These bots are only as smart as they are programmed to be. When you’re interacting with bots that use machine learning, on the other hand, your language doesn’t have to be ridiculously specific. Since these bots understand the nuances of language, not just commands, they continuously get smarter as they learn from the conversations it has with you and others.

Here’s the #1 reason you should care about chatbots: According to an April 2015 Business Insider article, for the first time ever people are using messenger apps more than they are using social networks. Let that sink in - people are using messaging apps more than Facebook, Twitter and other social platforms combined. I can see it with my 13-year-old daughter’s heavier use of SnapChat than Instagram. Simply put, if you want to build and grow business online, you need to build where the people are. That place is now inside messenger apps.

I’m personally very excited about the prospect of messaging-based chatbots and other intelligent agents. Why? Because I need tools that will help me get things done more efficiently and with less of my interaction required. I’m very optimistic that chatbots and intelligent agents will get us there within 3 to 5 years.

Plug those dialog leaks now

By engaging in more chats now you’ll both answer questions directly and start gathering a list of questions that you can answer directly via the content on your website. This reactive turned proactive approach will convince your visitors that you know who they are and what they want. And human psychology shows that people who feel listened to and understood are more loyal to you and likely to buy

Here’s the bottom line: if you don’t have chat on your site you’re losing sales big time. And if your chat experience or agents aren’t strong you’re still losing those higher-rate conversions that will result from having a human connection with your visitors.

Never forget that online selling is about talking with your prospects, having dialogues that expose and answer open questions and concerns, and show that you’re a brand that cares. Newer messaging-based chatbot tools will only improve these interactions by automatically answering the most common shopping questions. Do chat right and you’ll see your conversion rate and revenues grow soon, and your brand image improve.


source http://www.smartinsights.com/ecommerce/raise-ecommerce-conversion-rate-online-chat/

Tracking campaigns in Google Analytics

A how-to guide for campaign reporting with examples

Dashboard_KPI
One of the most important (but often overlooked) aspects of digital marketing is setting up your analytics properly. It’s a little bit technical but easy to do once you understand a few simple steps and see why it’s so important.

Being able to track where your visitors are coming from is a valuable opportunity to improve your engagement and your ROI during the campaign. Additionally, when you benchmark your campaign performance you will be able to improve your campaigns in the future, and budget more effectively. It’s worth investing a little time in analytics!

In this post, we’ll show you how to use Google Analytics to track visits to your website or landing page. This is the critical first step in being able to understand how your campaign is performing.

Once you can accurately see where your visitors are coming from, you’ll be able to build more useful reports such as “goal completions by conversion source” (e.g. how many leads or sales are coming from Bing versus Facebook), or “sales by source/medium” (using Google Analytics’ e-commerce reporting features).

Why track your marketing campaigns?

Marketers at the top of their game always want more data. When you know where your visitors are coming from and how each traffic source is converting on your site, you can make on-the-fly optimizations to your campaign and achieve better overall results.

With this campaign tracking data in hand, you’ll be able to benchmark against it when designing and budgeting for future campaigns, making your future campaigns even better. This is one form of data benchmarking, and it’s a powerful tool for any marketer.

What if you not thinking this way when setting up your promotions? For example, suppose you are running a contest and you’ve promoted it through print, email, Facebook Ads, Facebook Sponsored Posts, and Google Adwords. Visitors from these sources will appear in Google Analytics as follows:

googlecampaigntracking* These can show up as various sources such as m.facebook.com (Facebook’s mobile web page) and l.facebook.com (Facebook’s laptop/desktop version), depending which devices they use and if they are using http or https status.

In this example, you wouldn’t be able to distinguish visitors from print versus email. Your Facebook traffic will all show up as one stat, regardless of whether they clicked your post or an ad. Traffic from Google will all display as organic traffic, not paid traffic (cost per click).

The trouble here is that you can’t tell what the money spent on Facebook Ads or Google Adwords actually translated to in terms of leads, sales, sign-ups, etc. Did the Google Adwords spend pay off? Did anyone actually find your website through print advertising? You just won’t know. And the next time you plan a campaign, you’ll be just as blind.

But if you had known that mid-way through the campaign your Facebook Ads were converting at half the cost of visitors from Adwords, you could have applied the remainder of your Adwords budget toward Facebook Ads and boosted the overall ROI of your campaign. Or, suppose your analytics could have shown that all of your direct traffic was coming from print, and your email marketing wasn’t working - you could adjust your email messaging to get a better click-through rate there. Perhaps you are emailing to multiple lists (you should be segmenting!). Wouldn’t it be great if you could see your conversion rates for each email list separately?

You can get all of this data, and it’s easier to do than you think.

How to track your campaigns?

We’re using Google Analytics here as it’s so popular, but other analytics tools will have similar features.

When a visitor lands on your website, Google Analytics records that pageview along with the source and medium that the visitor originated from. The “source” is the domain that the visitor came from, and the “medium” is a classification for different kinds of traffic. There is also a “campaign” parameter that can be used to further segment your traffic.

Many tools like MailChimp, Hootsuite, Oktopost and Hubspot have features that let you create tracking URLs, but anyone can use Google’s own Tracking URL Builder.  You can automatically apply tracking parameters to all Adwords traffic by enabling Auto-tagging in Adwords (read instructions about how it works.).

A simple URL looks like this: http://qoints.com

A Tracking URL looks like this: http://qoints.com/?utm_source=smartinsights.com&utm_medium=referral&utm_campaign=guestpost

These UTM parameters (everything after the “?”) force Google Analytics to record this data into the visitor’s pageview. In your Analytics Reporting view, under Acquisition > All Traffic, you will see traffic from the above Tracking URL as:

source / medium = newsletter / email

and in the Acquisition > Campaigns report you’ll see this traffic under Campaign = agency-newsletter

Using Tracking URLs for the campaign promotion example above, we’d get this:

campaignurlspromotion

* using a simple URL when posting links to Facebook will report people who click the link as facebook / referral by default, but you can use UTM parameters to distinguish different campaigns if you want

The URLs below all go to the same fictitious landing page (http://example.com/), but they have different tracking parameters appended to them:

  • http://example.com/?utm_source=mailer&utm_medium=print&utm_campaign=agencies
  • http://example.com/?utm_source=contest-promo&utm_medium=email&utm_campaign=agencies
  • http://example.com/?utm_source=facebook&utm_medium=cpc&utm_campaign=agencies
  • http://example.com/?utm_source=facebook&utm_medium=referral&utm_campaign=agencies
  • http://example.com/?utm_source=google&utm_medium=cpc&utm_campaign=agencies

So, for each channel that you are promoting through, you should be using a unique tracking URL. This will automatically allow you to report on each channel, as well as reporting on each source, medium or campaign as an aggregate.

Important tips for measurement

  •  1. Plan and organize your parameters

Google Analytics simply records whatever it’s told, so organize your parameters ahead of time. It’s best to use a standard set of parameters company-wide. If your company uses a different set of parameters each time an email goes out, you won’t be able to easily report on things like overall traffic from email monthly or year-over-year. Analytics is case-sensitive too, so “Email”, “email”, “e-mail” and “E-mail” will report as four separate mediums.

  • 2. Keep it simple

It may be tempting to create unique parameters for all of the variables for each source, but this is not necessary, nor is it ideal. Each channel only needs its own unique combination of parameters in order to be reported on separately.

For example:

variablescampaignanalytic

These parameters will allow for reporting on all paid traffic, or all email traffic, or all traffic from the whole “summer” campaign as well as reporting on each channel separately by using combinations of the above in a segment or filter.

  • 3.  Start now

Any data is better than none. Start simple and grow from there. Optimizing your campaign strategy in response to real-time data is a powerful way to achieve better ROI for your campaigns. Benchmarking your digital marketing data over time is a sure-fire way to improve your future campaigns, too.
Watch our video


source http://www.smartinsights.com/google-analytics/google-analytics-campaign-tracking/campaign-tracking-aa09/