Wednesday, 26 October 2016

Understanding “digital brand awareness and recall” based on primary traffic drivers

Direct traffic is a great indicator of brand strength - marketers should consider it's use as a KPI

How a brand drives its traffic in the online arena is one of the most important things for any digital marketer to know. These traffic drivers can be divided broadly into these 7 segments

  • Direct
  • Mail
  • Referrals
  • Social
  • Organic Search
  • Paid Search
  • Display Ads

Each has its own implication on a brand’s online presence however for the scope of this article we will focus on Direct Traffic vs. Various Search metrics.

Direct Traffic is when a consumer directly types in the name of a brand’s website in the address bar.

Search Traffic is when a consumer is looking for information about a brand and its services/products via a search engine or directly inputting the name of the brand or its product/service, in a search engine.

Before we begin it is worth mentioning that a lot of the recall value of a brand cannot be connected with the direct traffic metric as a lot of people usually search for a brand name via search engines as well. For example, even if one is fully aware of what Yelp is or offers, people will still search for it via Search engines rather than directly visiting the website. This is primarily because they may want precise results of restaurants without having to go through the hassle of searching once they are on Yelp (in this case). This kind of a situation is excluded from the scope of this article as this defines consumer behaviour towards a brand which is a whole new topic all together. A strong brand which is not able to drive traffic to its website via its own brand name is a problem worth mentioning however it is a moot discussion in this case as this article considers direct traffic to be a very good indicator of brand recall and awareness. This aritlce will show that Direct traffic is the ultimate metric for defining brand strength, awareness or recall in the online realm when it comes to traffic share analysis.

Let’s move on to the fun stuff and compare well known brands to see their traffic share and to define their brand strength, awareness or recall.

Online Shopping Sector - USA

search-traffic-breakdown-for-online-shopping-setor-usa

Ebay has the strongest graph when it comes to direct traffic, closely followed by Amazon. Overstock’s organic search traffic is the most and direct traffic the least as compared to its competitors. This is indicative of a developing brand in the sector. This is further confirmed by Overstock leading the display ad traffic segment and closely following Walmart in paid search traffic segment. Visual aid is always a good support structure for developing brand recall. (Remember the traffic driven to these websites on a daily basis is in the millions therefore we have a significant sample size). A strong brand here should correlate with direct traffic values. The consumer is likely flock to either one of Amazon, eBay, Walmart, Best Buy or Overstock for all their online shopping needs.

Key Takeaway:

Ideally during the journey of a brand from inception to maturity, the graph will shift from high paid search traffic, to organic traffic and subsequently to high direct traffic. The high direct traffic goal hasn’t been achieved by many brands because of the simple fact that consumer behaviour online dictates that most people usually “Google” things even if they already know about them. Google acts as a grocery store or hyper mart of sorts that stocks all brands and when people come to visit asking for various items, it suggests the best ones. In the online realm if one is to buy a shirt they would also go through a range of shops in a mall or in a particular shopping arena only to decide on the best fit, style, comfort etc. However if one were loyal to a brand then its strength would show simply because they would put the brand at the top of their consideration set during discovery or purchase. This consideration set can be figured out based on organic search and direct traffic metrics. If a brand has high organic search and direct traffic metrics rather than referrals, social, mail or paid search metrics then it can be considered a strong brand in terms of awareness and recall both.

However it can be established that some brands have transcended these metrics and established themselves as leaders in direct traffic share and these are the truly valuable brands in the online realm, these are the truly developed brands and these are the brands that have become verbs.

Note: We are excluding Google itself from our analysis since that would be highly imprudent for obvious reasons. All hail Google!

Strong Brands - Global

global-digital-brands-search-traffic

Direct traffic share is towering significantly above the rest of the traffic drivers. All the brands above are operating at above 50% direct traffic share. Yahoo and Facebook are in close competition at around 61%. This shows the recall value and also awareness that these brands hold in the minds of their consumers. (Again please note that traffic values are in the millions per day therefore highly significant numbers).

Health News - UK

uk-health-sites-traffic-breakdown

The health news sector is also dominated by organic search traffic just as the online shopping sector was in the US. In this case it is even more so as most medical knowledge related information is always “searched for” as per prevailing consumer behaviour in today’s day and age. Even though WebMD is a strong brand, there aren’t significant sections of the population that are directly reaching it in order to make it a strong brand online.

This is the “normal” in this realm and it is doubtful that it will ever be overcome as these sectors are playing within the perpetual information discovery phase of the audience. Ideally, a strong brand in this sector should have very high direct traffic, strongly indicating that people trust this brand to give them the best of everything. In this case the best fitness news, disease prevention advice, drug related information, the best user experience or anything else a consumer thinks is worth their time and effort. This is also called “brand equity”, this is what the consumer is willing to forego when it chooses one brand over the other but this will never be the case here.

Defining Benchmarks

Therefore it is best to define metrics of how much direct traffic is considered strong brand awareness and recall. From the online shopping and health news graphs it can be seen that neither one of the strongest brands in the sector reach anywhere near the 50% value, in-fact most of them are operating under 40% . It remains to be seen how these graphs will play out over the next couple of years- whether they’ll go up or down is pure conjecture at this point in time. However, at current values when these brands have spent a significant amount of time and money and crossed the “paid search” stage of their online brand presence, it can be safely said that anyone in the health news & Online Shopping sector should consider 40% direct traffic as a benchmark of branding success in their own geography of operation.

It is also safe to say that neither the health news sites nor the online shopping websites will ever cross the 50% limit of equilibrium between direct and organic traffic purely due to consumer behaviour in the sector.

So far we have only analysed the developed brands, now let’s take examples of developed and developing brands both at the same time.

Telecommunications Sector UK - Developed

uk-telecommunications-sector-traffic-breakdown

Let’s try and understand which of the telecommunications providers in the UK have a better brand awareness/recall in the online realm, using the method described above.

Orange is leading brand awareness and recall based on the 54% direct traffic values as compared to only 5% organic search values it is registering online. Vodafone UK has a high organic search metric, it seems they have caught on to this and are trying to increase brand recall and awareness with the help of paid search and display ads. Virgin media and British Telecom have similar direct traffic and organic search parameters of around 45%, with similar organic search metrics of around 24%. The graph is representative of the benchmark definition and the overall view of this article, as it can be successfully established that the developed brands are showing the right kind of direct traffic metrics as compared to the organic traffic.

Online Men’s Grooming Sector - US & UK

us-and-uk-mens-online-grooming-traffic-breaksown

All types of traffic generation techniques are in play here and the sector is highly competitive. Even mail campaigns are at a high (even 5% for mail campaigns is considered high traffic). Referrals, Social Traffic, Paid Search, Display ads all are being invested in. This is a very good way to identify a developing sector and brands in their development phase. When a traffic share analysis shows that almost all 7 methods of traffic generation are being utilized at some level or the other, the industry is nascent and brands are trying to position themselves as best as they can. In this case a strong social positioning strategy can be seen clearly.

Conclusion

The idea of the article was to establish traffic share analysis as a method to differentiate a developed brand from a developing one, by looking at direct traffic and organic traffic metrics as compare to the rest. It is safe to say that this has been established by analysing the many industries above. It is imperative that digital marketers keep this in mind when describing brand journeys for their brands in the online realm.


source http://www.smartinsights.com/search-engine-marketing/keyphrase-analysis/understanding-digital-brand-awareness-recall-based-primary-traffic-drivers/

The Lifecycle Marketing Model

Planning and optimising across the whole customer journey is the most effective way to win and retain customers.

Anyone who's worked for an Ecommerce business, or indeed just about any kind of business, will know that customer retention and re-activation is the key to driving consistent growth in profit.

Attracting entirely new customers at the top of the funnel can often become the focus of Ecommerce campaigns because you naturally want to get more and more people into that funnel to convert and thus make you money. But if you have not invested sufficiently in creating an engaging customer lifecycle which converts and re-engages your customers to tempt repeat purchases then attracting new customers will not be the most effective tactic. You should be focusing on improving the customer lifecycle itself.

I'm going to show you why with a nifty little tool I like to call maths.

benifits-of-investing-in-customer-lifecycle

In this hypothetical scenario, the person who invested in a better experience across the customer lifecycle was rewarded with an increased conversation rate and customers willing to buy from the brand again on several occasions. Though in both scenarios the average order value and the average cost of attracting web visitors is the same, the business which has invested in customer experience across the lifecycle could generate significant profits from attracting customers, whilst the other business cannot generate a profit.

So it's clear that creating an excellent customer experience across the entire journey is of critical importance to a company's bottom line and future growth. But how can this be achieved? We've developed a new chart to plot a customer's journey and their potential value to a business over time, which is relevant to both eCommerce and bricks and mortar retailers. Click on the image itself to see an enlarged version.

lifecycle-marketing-model

The chart maps 25 different marketing, advertising, user experience, and customer support related activities across a given customer's journey, and shows how someone making a first purchase can either become a lapsed customer, or become loyal based on their experience in the latter half of the customer journey- the all important engagement stage. I can almost hear the audible sigh emitted from marketers everywhere at the massive complexity of trying to optimise the entire customer journey, but no one said lifecycle marketing was going to be easy!

It also maps the customer lifecycle across the RACE framework, which helps you break down you plan your activities and structure your KPIs for different departments or teams working to boost varying aspects of the customer lifecycle. The diagram below gives more clarity as to the KPIs you will want to consider and how they are divided into Reach, Act, Convert and Engage.

race-framework-kpis

RACE is extremely useful for developing a successful lifecycle marketing strategy because it deals with the full scope of the customer journey from initial contact with the brand, conversion and finally engagement for repeat business. But RACE is not the be all and end all. Other models are also useful for structuring thinking in relation to the customer journey.

The diagram below we developed by using Google's ZMOT model and McKingsey & Company's customer decision journey- which includes the all important 'loyalty loop'. It helps marketers consider how customers make the all important decision to purchase and how marketers can successfully nudge them into becoming a repeat customer. consumer-decision-journey

How can marketers use the lifecycle marketing model?

First of all, the lifecycle marketing model we've developed isn't really strictly a 'model', it's more of a useful concept combined with our RACE model to make a kind of hybrid marketing model. We can't lay claim to be the originators of any kind of lifecycle marketing model because plenty of people we're using the term 'lifecycle marketing' before we started using that term. However we think by mapping the key activities which need to be considered by marketers across the RACE framework, we've created a useful way for marketers to structure their planning, consider where needs investment, and decide on KPIs.

To get the most out of our lifecycle marketing model, follow these 3 steps:

Step 1- Compile your list of activities

Consider how your organisation is currently using the 25 different activities we've mapped out across the customer journey. Build a list and note down which are being used. Think if they're are any opportunities you are missing out on by not using some of the techniques. If there is a technique you feel you certainly should be engaging in, but aren't as of yet, add it to the list.  Not all techniques will be relevant to all businesses- for example, if you're an SME eCommerce business, you probably won't need to consider TV advertising. Once you've removed those activities you know you definitely won't be considering (for small businesses this may be many, for larger organisations that combine physical stores and eCommerce, this may be very few or none)  then the list will provide the areas you need to focus on.

Step 2- Plan and budget accordingly

You can now use this list to inform how you construct your marketing plan and decide how to assign time/budget to various areas. Utilising the RACE framework, you can see how your budget breaks down by efforts to attract new visitors (reach), interacting with incoming visitors (Act), getting visitors to purchase (Convert) and keeping customers returning so as to facilitate future repeat custom (Engage). Mapping out your plan like this lets you spot and address areas of weakness. It may be that you're focusing too much on getting more customers into a funnel that hasn't received enough investment and thus is very leaky. Or it may be that you've been focusing all your efforts on converting customers, but are failing to attract new prospects.

Step 3- Assign KPIs

The key to actually realising your plan and not have it just be a wishy-washy document that sets out a brilliant vision that is never really implemented is setting useful, actionable and achievable KPIs. For a KPI to be useful and actionable it must be highly specific to the activity being carried out, otherwise it won't give meaning to the person who's job is entirely focused on that area. For example giving email marketers targets around achieving re-activations from customers who haven't purchased in several months makes sense as this to getting customers back into the lifecycle rather than lapsing. But giving email marketers KPIs that are just about engagement in a general sense and are poorly defined will not get the results intended. Use the lifecycle model to generate specific KPIs for teams working across the 25 areas identified, and align these with the overall goals of RACE to develop a successful customer lifecycle which attracts plenty of new customers, but also keeps them engaged and coming back for repeat business.


source http://www.smartinsights.com/marketing-planning/marketing-models/lifecycle-marketing-model/

How ‘dropshipping’ is going to transform your eCommerce in 2017

Partnering with a supplier can save time and boost profits.

Ask any eCommerce retailer what is the number one concern they have and inventory will likely enter the equation. Fulfilling orders yourself is time-consuming and not always the cheapest option in the long run. Hiring employees to do it cuts into your profit margin.

So what’s the solution?

Dropshipping.

If you haven’t heard about this rising trend in eCommerce order fulfillment, let this article be your guide to understanding dropshipping, how it makes you a better business owner, and what to expect in the coming months.

What Is Dropshipping?

the-dropship-model

Image: Oberlo

Rather than you buying inventory, stocking it, then packaging and shipping it out every time an order comes in, dropshipping allows you to sell products that are housed by your manufacturer or a wholesaler. They store it until you sell it. And you don’t pay a dime until you sell it.

The benefits here are many. For one, you don’t have to tie up your money in inventory. Instead, you buy products from the manufacturer or wholesaler when an order comes in. Your risks are significantly smaller in this case - you already have the money for the order, so you place your own order for that item to be shipped directly to your customer. And unsold inventory is hardly an issue.

The fact that it requires essentially no money to start an eCommerce business using dropshipping services is an appealing one. In fact, it’s easier than starting other types of businesses. You just select the products you want to offer for sale on your store from a marketplace like AliExpress, create product pages, and bam! You’re selling products without ever having to touch the inventory.

You also free up your time, with none spent on inventory management or shipping. No more running to the post office six times a day! That means you have more time to focus on marketing your products and ensuring that customers are pleased.

Another benefit of dropshipping is that you can test out different types of products to see what your customers want or get inspiration from AliExpress’ Best Selling category and start dropshipping it right away.

Why Dropshipping is Going to Explode in 2017

While dropshipping is far from new, it’s seen a sharp increase in popularity over the past few years, likely due to a few reasons.

First of all, dropshipping solutions like Oberlo now bridge the gap between suppliers and sales solutions like Shopify to help ecommerce store owners get access to quality products without having to seek out multiple suppliers to do so. Customers get a seamless shopping experience and can even track their orders, so they’re happy and your revenues rise.

ecommerce growth asia

Image: PhotoSpin

eCommerce itself is on the rise (online shopping has increased 45% in 2016 alone), which means more people are spending more money on products they find online. With soaring demand, more players enter the space, and dropshipping is the solution many of them choose to adapt.

It makes fiscal sense. Rather than investing $10,000 in a product you don’t know if you can sell, instead you invest nothing until you sell a product. Yes, your profit margin will be lower, but you’ll still bring in money with smaller effort on your part.

How to Start Dropshipping

If you already have an eCommerce store and struggle to keep up with high minimum order requirements, or if you’re running out of space to keep your inventory, dropshipping can make your entrepreneurial efforts less stressful and more lucrative, even if you’re completely new to eCommerce.

If you’ve opened your eCommerce store with Shopify, which offers a comprehensive eCommerce store builder platform, you’re already set up to take advantage of its dropshipping applications, which make it easy to add products to your store, update inventory, and track sales.

Of course, you could set up your own website, but consider the downside - you’ll end up doing more work to get it up and running. When you start with a solution that has eCommerce and dropshipping working in harmony, you don’t have to bridge the gap yourself by trying to figure out how to get an order fulfilled on your site with a separate dropshipping platform. You can keep inventory numbers updated (if the supplier is out of a product, it automatically is removed from your website) and streamline the order process.

Because you don’t have to focus so much on inventory and order fulfillment, be prepared to spend time and money on marketing your eCommerce business. Online ads, blog posts, and social media are just part of the equation you should use to ensure that people find your eCommerce store among the thousands out there.

Another way to stand out is to find a niche. Anyone can sell t-shirts, but fewer stores will sell organic cotton baby tees, for example. So find a corner of eCommerce that you love, and one that everyone else isn’t selling, and you’ll thrive.

Whether you’re just starting an eCommerce store or looking for a better solution to improve existing operations, dropshipping can help. By taking the headache out of stocking inventory and shipping it (not to mention processing returns), you’ve solved 90% of the problems that eCommerce businesses have. Now you can focus on ensuring that your brand is out there, front and center, ready for more sales.


source http://www.smartinsights.com/ecommerce/fulfillment/dropshipping-going-transform-ecommerce-2017/

Desktop vs Mobile web use #ChartOfTheDay

How the the Multichannel Majority varies between different sectors

Our mobile marketing statistics summary shows how mobile use has increased such that it now exceeds desktop use in many categories.  Following the lead of Google and others, you now often hear marketers and designers talking about adopting a Mobile-first design approach when upgrading their websites. Many responsive designs are led by the mobile experience. This often leads to a simplified design approach which is positive for users and conversion. I was recently working on  a consulting project in the insurance sector and it was interesting to see how insurance comparison sites like Money Supermarket, Confused.com and the AA have all adopted a mobile-first design philosophy with simplified designs and reduced copy.

While this is positive, I've chosen today's Chart of The Day to show that it is an over-simplification. The reality is that while smartphone use is overwhelmingly popular for some activities such as social media, messaging and catching up with news and gossip, the majority of consumers in western markets also have desktop (and tablet) devices which they tend to use for more detailed review and purchasing. This explains why mobile conversion rates are much lower in retail and why the breakdown between traffic for retail sites is broadly equal between smartphone and desktop.

The chart from audience measurement platform comScore shows that in many sectors like banking, entertainment and retail there is a multichannel majority who use both desktop and mobile so designs should cater for both.

Multichannel Majority Desktop-vs-mobile use

So we need to think about strategies to engage the Multichannel Majority not simply a 'Mobile first' approach.  Adaptive design approaches where desktop and tablet users get a different experience consistent with their context, intent and larger real estate are a technique that can be used to help with multichannel behaviour. comScore has talked for some time about strategies to engage and measure the multiplatform majority across devices and I think there will, or should be more focus on that in the years ahead.


source http://www.smartinsights.com/mobile-marketing/mobile-marketing-strategy/desktop-vs-mobile-web-use-chartoftheday/

Tuesday, 25 October 2016

Mobile Marketing Statistics compilation

Statistics on consumer mobile usage and adoption to inform your mobile marketing strategy mobile site design and app development

"Mobile to overtake fixed Internet access by 2014" was the huge headline summarising the bold prediction from 2008 by Mary Meeker, an analyst at Kleiner Perkins Caufield Byers who reviews technology trends annually in May.

The mobile statistics that the team at Smart Insights curate in the regular updates to this article include:

  • Ownership of smartphone vs Desktop
  • Mobile vs desktop media and website use
  • Mobile advertising response
  • Smartphone vs Tablet vs Desktop conversion rates

Well, we're now past the mobile Tipping Point as this report from comScore shows. So it's no longer a case of asking whether mobile marketing important, we know it is! It's now a question of using the statistics to understand how consumers behave when using different types of mobile devices and what their preferences are.

Mobile stats vs desktop-users-global

To help you keep up-to-date with the rise in consumer and company adoption of mobile and its impact on mobile marketing, I will keep this post updated throughout 2016 as the new stats come through to support our 120 page Expert members Ebook explaining how to create a  mobile marketing strategy. We also have this free summary mobile strategy briefing for Basic members.

We have  grouped the latest mobile stats under these headings for key questions marketers need to answer about mobile to help them compete:

  • Q1. Time spent using mobile media
  • Q2. Percentage of consumers using mobile devices
  • Q3.  How many website visits are on mobile vs desktop devices?
  • Q4. Mobile device conversion rates and visit share for Ecommerce sites?
  • Q5. Mobile - app vs mobile site usage?
  • Q6. How important are mobile ads

OK, let's go!

Q1. How much time do consumers spend using mobile media?

Mary Meeker's annual spring updates on mobile are a must-read if you follow consumer adoption of technology platforms, so we have used some of the key findings from the latest KPCB mobile technology trends by Mary Meeker. Her deck is nearly 200 slides, so we have selected the statistics which best summarise the importance of mobile devices today.

The latest data shows that we are now well past the tipping point mentioned at the top of this post. Mobile digital media time in the US is now significantly higher at 51% compared to desktop (42%).

mobile

The implications are clear - if you're not able to reach your audience through mobile search or display, or you're not providing a satisfactory mobile experience you will miss out compared to competitors who are.

The trend in mobile device usage ('vertical screens') compared to all screen use again shows that we're well past the tipping point.

time spent on mobile vs desktop devices 2015


Q2. Percentage of consumers using mobile devices?

We've created a new summary showing the global popularity of using different digital devices using data from Global Web Index to include in for our State of Digital Marketing 2015 infographic.

It clearly shows the popularity of smartphone ownership and emerging mobile devices like Smartwatches.

desktop-vs-mobile-most-popular-devices-2015

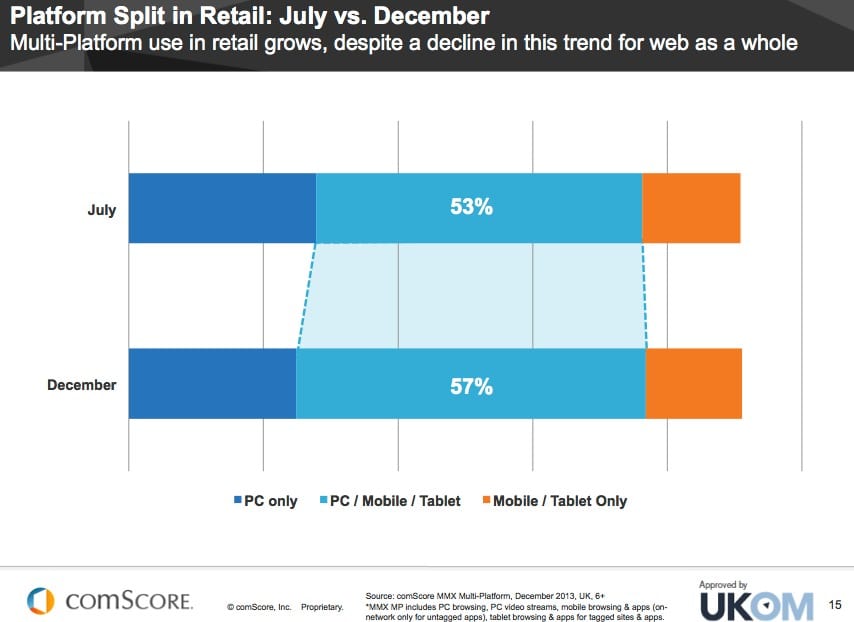
Insight from comScore published in their February 2014 market review shows the picture that marketers need to build up. This panel data shows that the majority of consumers are "multiscreening", accessing retail sites on mobile or desktop, so consistent experiences across device need to be deployed.

Split-mobile-desktop-retail

You need to answer this for your own site. As Rob Thurner explained in his post on KPIs to review mcommerce effectiveness, it's important to keep track of the split between users of mobile and desktop devices visiting your site(s). Using advanced segments in Google Analytics is the best way to do this.

Q3. How many website visits are on mobile vs desktop devices?

However, we need to be careful with interpreting data on hours spent, since we spend most of our time on smartphones checking email and using social media. This has led to the common mantra of 'mobile-first' design which I think is dangerous. Eric Schmidt, then Chairman of Google talked about a mobile-first approach. The reality is that while smartphone use is overwhelmingly popular for some activities such as social media, messaging and catching up with news and gossip, the majority of consumers in western markets also have desktop (and tablet) devices which they tend to use for more detailed review and purchasing. So we need to think about strategies to engage what comScore call the Multichannel Majority not simply 'mobile first' or 'smartphone adoption'.  This explains why mobile conversion rates are much lower in retail and why the breakdown between traffic for retail sites is broadly equal between smartphone and desktop. Audience measurement platform comScore has talked for some time about strategies to engage and measure the multiplatform majority across devices and I think there will, or should be more focus on that in the years ahead.

This UK data also shows the importance of the multichannel majority in sectors like Retail and to a lesser extent banking, but that for some niches like weather 'mobile first' is more accurate.

Multichannel Majority Desktop-vs-mobile use

Their latest data for the US is striking in shows how the multi-device majority dominate, particularly amongst millenials.

Although mobile is growing in importance, this older data from Adobe's latest Digital Index (not updated yet in 2016) shows that in all industries the majority of visits are still on desktop.

Percentage of desktop vs mobile visits 2016 data

So with so many site visits still on desktop, it's important when designing using a responsive web design that the desktop experience isn't degraded and this has led to many larger businesses using an adaptive web design where layout and content are tailored for desktop, tablet and smartphone screen dimensions.

Q4. Mobile device conversion rates and visit share for Ecommerce sites?

We have a separate compilation of Ecommerce conversion stats if you're creating a business case for mobile optimised sites as explained in our mobile marketing strategy guide, this data is also valuable since it shows the variation in conversion rate by mobile type. This is the latest data from Monetate for their retail clients showing conversion rates.  2016 Ecommerce retail conversion rates by device

The data clearly shows that Smartphone add-to-cart and conversion rates are much lower than for desktop - important if you're making the business case for a mobile responsive site.

Conversion rates by mobile device type 2016


This source is useful since it's a regular survey showing the growth in use of mobile site visitors. enables you to drill down to see usage by device type, for example iPad is still the dominant tablet, but Kindle Fire and Android tablets now account for over 10% of tablets. You can see that tablet and smartphone use nearly doubled in the year based on 500 million plus visits for these retail clients (see link above for methodology).

Q5. Mobile media time - app vs mobile site usage?

Consumer preference for mobile apps vs mobile sites should also be thought through as part of mobile strategy. This data from Nielsen on mobile media time shows the consumer preference for mobile apps which account for 89% of media time in mobile as might be expected from the use of the most popular social network, email and news apps.

Mobile app vs site usage

App usage (90% of time) dominates browsers in mobile usage

We reported comScore data in May 2012 that showed that on smartphones 82% of mobile media time is via apps.  Today, the latest data from Yahoo's Flurry analytics shows that 90 percent of consumer's mobile time is spent in apps. As they put it,put it: It’s an App World. The Web Just Lives in It. This is a key insight as companies decide whether to develop mobile apps or create mobile device specific apps.

This 90% figure is a key insight as companies decide whether to develop mobile apps or restrict themselves to mobile optimised sites.  You do have to be careful about interpreting this since, as the chart below shows, Facebook, messaging, games and utility apps will naturally have the greatest time spent and browser use is still significant by volume if not proportion. But this has implications for advertising on mobile to reach consumers using apps like Facebook and Gmail.

Q6. Mobile Ad Spend still lags behind Mobile Media Consumption

So, how have advertisers responded to the change in mobile media time? The next chart shows that despite the growth in media time above, some advertisers are missing out since the right-most bar shows that there is a huge missing opportunity on mobile advertising

internet trends

This research sourced from a 2015 study by eMarketer into mobile ad budgets shows a different view. In 2015 mobile ad spending accounts for 49% of digital ad spending, which is only slightly behind the trends of how people are using their devices. These stats also show projections for future growth, which is important as it shows where the market is going. It is clear that mobile is the future, and within 3 years it will come to dominate digital ad spending.

  2015 2016 2017 2018 2019
Mobile Ad spending- Billions $ 28.7 40.5 49.8 57.7 65.8
Percentage change 50% 41% 23% 16% 14%
Percentage of digital ad spending 49% 60.4% 66.6% 69.7% 72.2%

Q2. How consumers research products using mobile search and review sites

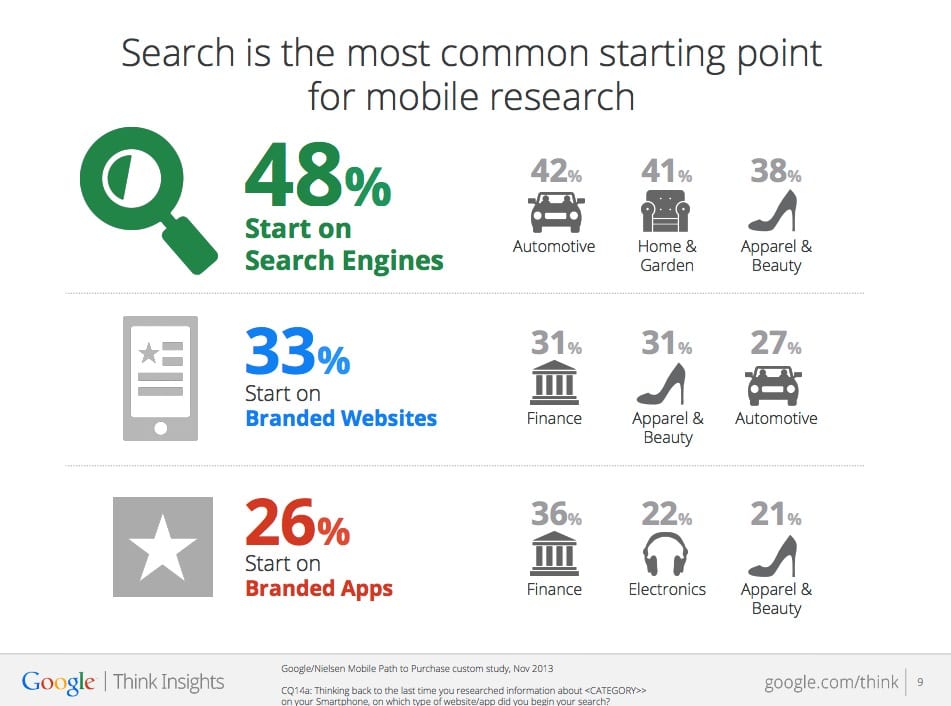
Google's mobile path to purchase report surveyed 950 US consumers across 9 different verticals (Restaurants, Food & Cooking, Finance, Travel, Home & Garden, Apparel & Beauty, Automotive, Electronics, Health & Nutrition) to assess how they researched purchases via mobile. A key finding is the starting point for mobile research. As might be expected search was the most common starting point, but it's lower than desktop showing the importance of branded apps and mobile sites.

Mobile commerce statistics 2014 research

The 5 best sources for mobile marketing statistics?

This update to this post features some of the latest updates on mobile statistics from 2014 and highlight some of the best sources to make the business case for investment in mobile marketing in your presentations and business cases to colleagues or clients.

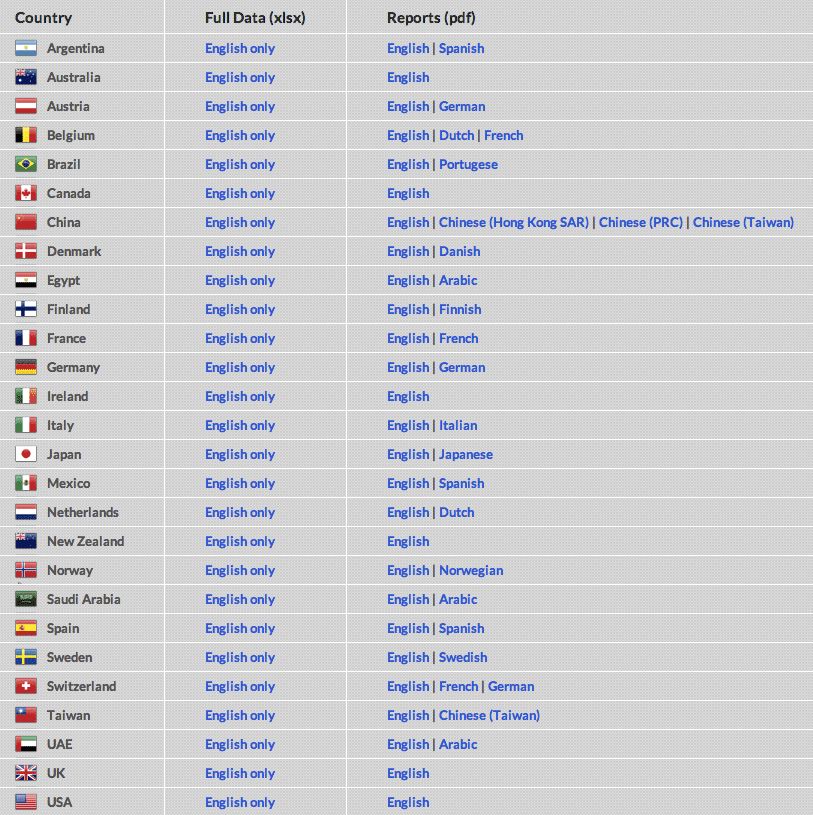
  • 1. Google Mobile Planet. A regular survey for different countries starting in 2011, this enabled you to prepare your own reports. Now this has been replaced by Google's Consumer barometer which enables you to create similar reports.

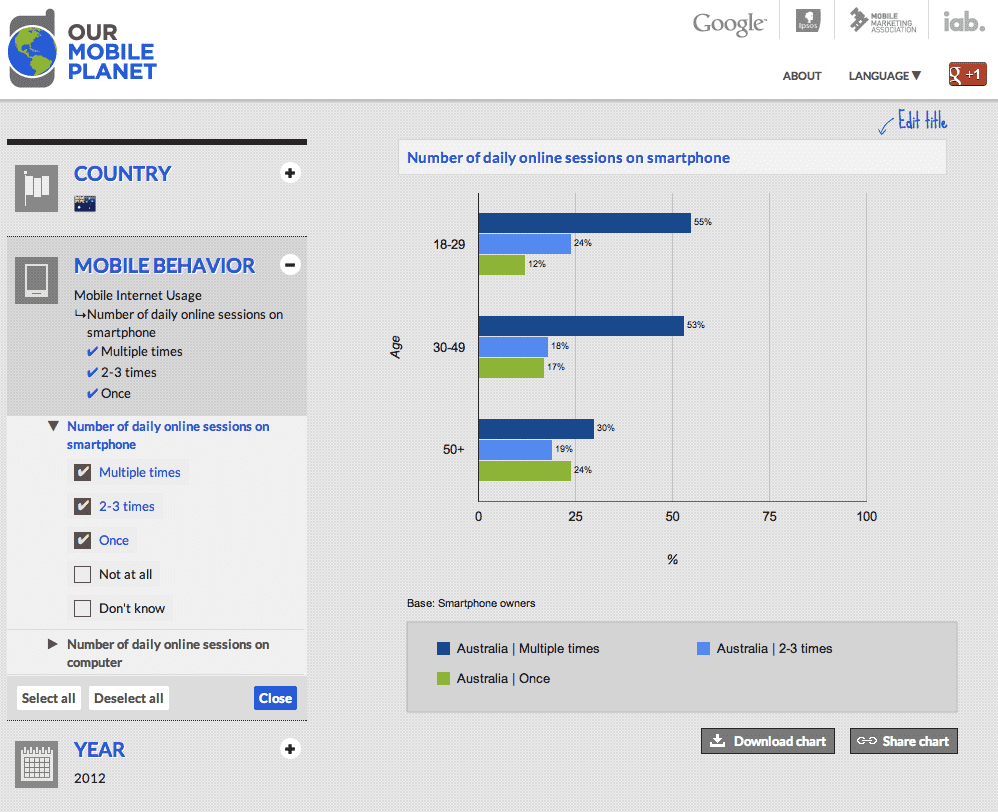
In addition to downloads for each country, you can also create your own charts focusing on KPIs of interest. For example, if you're based in Australia you can look at usage by demographic.

The weakness of the current data is that it focuses on Smartphones, not tablets. It may be useful for pushing back against over-enthusiastic colleagues or understanding consumer barriers. For example, less than a third of Australians have ever bought on a smartphone and you can see there are barriers of security and preference for desktop purchases.

  • 2. ITU. The International Telecoms Union data reports mobile usage including mobile broadband subscriptions to show growth in use of mobile. This reported at country, continent and overall levels, so is the best overall source for mobile penetration worldwide. Much of the information is free - see their free mobile statistics section.

  • 3. Flurry Mobile Analytics. This is a great source for showing the overall level of app usage across the four major mobile app platforms by country and drilling down into the popularity of individual apps for different sectors like retail, banking and travel. For example, the latest mobile app growth figures from Flurry show growth of category use by more than 50% in many categories.

Growth in mobile app usage


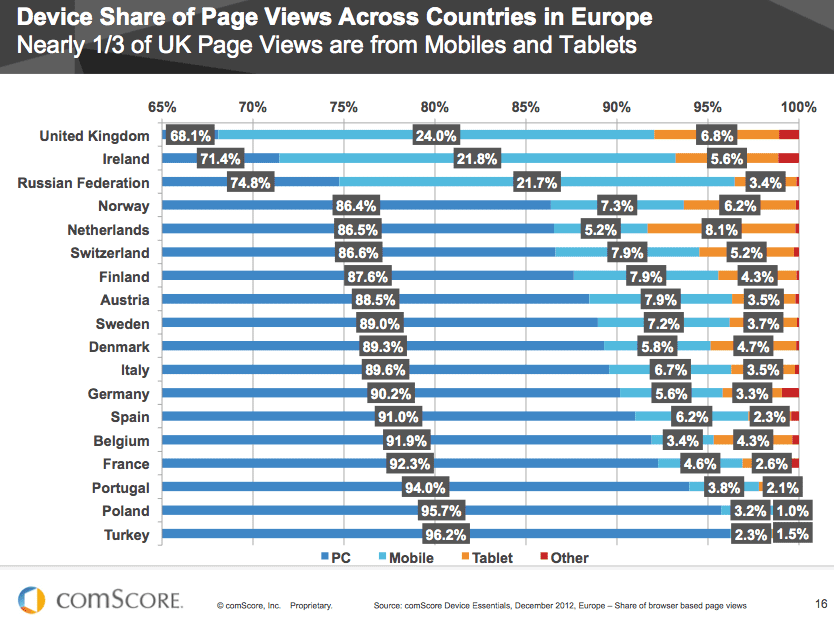
Comscore is one of the key worldwide sources useful for marketers to help us find out about the changes in use of mobile media by consumers. This graph shows the pattern across Europe - follow the link above for US and other country breakdowns.

The report shows much lower levels of adoption in other European countries though - not even a fifth in most. So extrapolating UK behaviour to other countries would seem to be a mistake with the mobile figure still key.

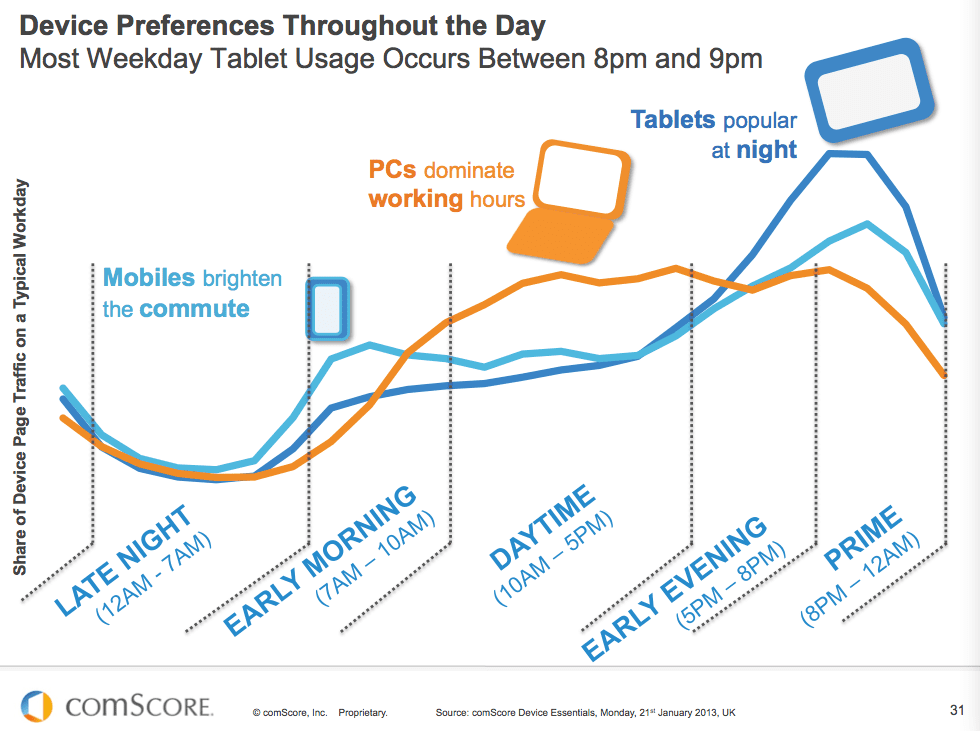
The report also has useful summary of dayparts of different device behaviour, similar to others published.

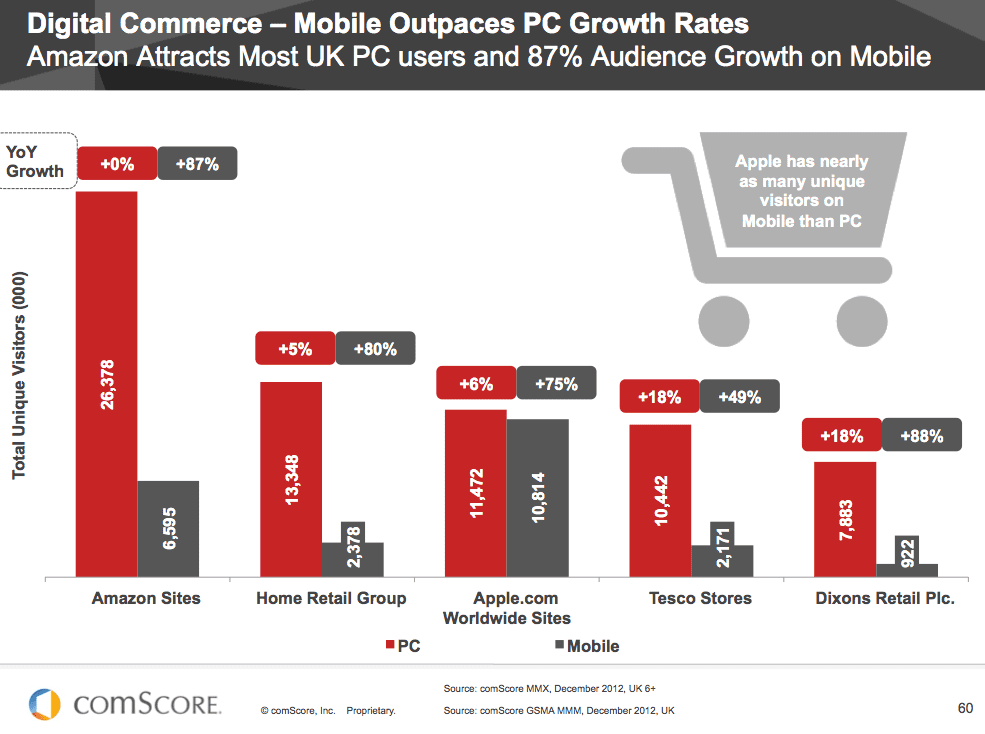
Retail mobile use

Mobile was again the focus of the section on retail statistics. Audience growth rate is 80% + on mobile in these UK sites, but lower on grocer sites for obvious reasons.

  • 5. Ofcom Internet usage report. Ofcom’s Eighth International Communications Market Report was published in December 2014, this examines take-up, availability, price and use of broadband, landlines, mobiles, TV, radio and post across 17 major countries. As example, here's the picture of desktop vs mobile device in the UK showing that when you look at most important device, desktop and laptop remain important.

We hope this compilation of statistics about mobile usage and effectiveness continues to be useful - please share if it is and we'll continue to update it in 2015.

If you want a single source of the latest stats across the whole of digital marketing, for Expert members, we compile a regularly updated set of usage statistics to use in presentations - it's updated each quarter so all the latest stats are categorised in a single place for including in presentations.


source http://www.smartinsights.com/mobile-marketing/mobile-marketing-analytics/mobile-marketing-statistics/

What services are marketers looking for from agencies? [#chartoftheday]

Digital Strategy moves into 2nd place whilst Branding advice becomes less sought after

Many senior marketers search for an agency starts exactly where you might expect, by searching.

Agency Spotter, which helps connect agencies and buyers have analysed their search traffic to reveal just what marketers are searching for when they are looking for an agency.

The results can be used to help agencies adapt their offering. The data reveals the services that were being searched for the most and the change over time.

screenshot-2016-10-25-14-53-29

Advertising, digital strategy, social media, as well as marketing strategy and mobile marketing stayed top consistently from 2014 to the first half of 2016. Searches for these terms didn't change much at all over this period, suggesting longevity of the needs for these services.

Branding, design strategy, eCommerce and communication design searches declined heavily over the period. Interest in user experience and email marketing also declined, as well as gaming.

Innovation, PR and analytics took a dive in 2015 but searches increased again in 2016.

Strategy, advertising, social media and mobile services are consistently required, however branding is in decline.


source http://www.smartinsights.com/agency-marketing/what-services-are-marketers-looking-for-from-agencies/

Facebook upgrades mobile pages, adding more call to action options [@SmartInsights Alert]

Mobile versions of Facebook business pages user interface are given a major overhaul, which promises to benefit small businesses

Importance: (For Businesses using Facebook pages)

Recommended source: Facebook’s announcement

October 2016 update:

Facebook announced last week that it's let business pages use a series of new 'Call to Actions' to provide users with a seamless mobile experience. This will be good news for businesses using Facebook pages - particularly small or micro businesses that wouldn't otherwise have the resources to create the best mobile experience.

These new call to action buttons won't link through to the business's site (which may not be mobile optimized) like the old ones did, but instead they'll take prospective customers to a simple form that's easy to complete in a few taps of the thumb.

In addition, rather than being 'one size it's all' you can choose from a range of different buttons that let customers order products, book appointments or buy tickets.  This means a takeaway can let people place orders, whilst a dentists can let users book appointments, all on simple and easy to use forms designed specifically for mobile devices.

Integration with Facebook Messenger

If the call to action options don't fit your businesses perfectly, Facebook have also created another option to let people use the Call to Action button to automatically send a message on Facebook Messenger to your page asking about your services. You can also link through to the shop section that you can create on your Facebook Messenger, which is great news for eCommerce business.

The messages available at the moment can be used to:

  • Get a Quote
  • Request a Time
  • Shop Now - takes users to your shop built within Facebook. Purchases can be completed through Messenger.

The image below show how one of these Messenger based call to action buttons work:

facebook-pages-calls-to-action


Update from December 2015:

It’s been a good year for Facebook getting businesses to use their platform. The number of businesses Facebook pages jumped by more than 10 million since April 2015, and is now at 50 million.

Facebook business pages

According to Facebook's latest announcement, 45 million businesses now use Facebook to reach their audience. Facebook hasn’t always been kind to them. After encouraging them to buy adverts to increase ‘Likes’ they then greatly restricted organic page reach, thus forcing them to pay to boost posts in order to reach a reasonable percentage of their audience. However, they have recently decided to give businesses a big boost to how effective their Facebook pages will be.

Facebook have been hazy on dates for when these changes will occur, and rather than committing to any timetable have only said that they will 'continue testing and adding new features to Pages' so check your Facebook page is up to date and stay tuned for further updates! We're not seeing these updates yet, but will let you know when we do.

New 'Sections' for pages give new options for businesses to explain their offerings

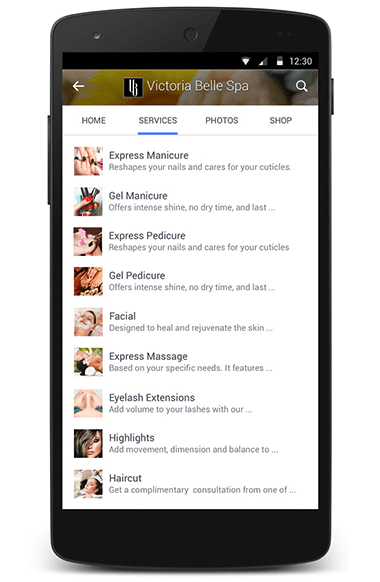
In this upgrade to how businesses' mobile pages will work, Facebook explained that pages would have a new tabbed mobile layout which would feature a shop section for retail businesses and a services section to showcase the services they provide.

Facebook mobile pages

Facebook explains the differences between the new sections this way:

'The new Shop section helps retail businesses bring their products to the forefront of their Page, while the new Services section enables professional services businesses to showcase a list of their offerings at the top of their Page'.

The Shop section will be a virtual store-front that will feature buy buttons including those powered by Facebook’s partnership with Shopify. Allowing purchases within Facebook is in Facebook’s interest because it keeps users within their platform, but it also transforms businesses Facebook pages from being mouthpieces for their marketing efforts to being a key part of revenue generation. Managers and CFO’s take note; all the marketers who’ve been nagging you for budget to revamp and promote your company’s’ Facebook page might just have been right when they said it would deliver that all-important ROI.

Emboldened Call to Action Button

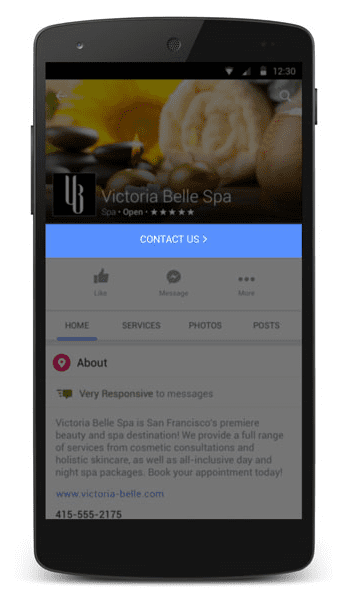
The update will also change the layout of call to action buttons on businesses Facebook pages. The have been made more prominent, bigger and brighter. Appearing directly under the pages cover photo and spanning the whole width of the page. Businesses using Facebook would do well to make sure their call to action accurately reflects what they want to achieve from their Facebook page. You can choose from ‘Shop Now’, ‘Book Now’, ‘Learn More’ and ‘Sign Up’, or ‘Send Message’ if your offering is unique to each customer and will need personalisation.

Call to action button Facebook

Different calls to action will obviously work better for different businesses, so make sure to go with the one that will make the most sense for your potential customers. If more than one could easily apply to your offering, then consider testing different buttons and measuring the results in terms of conversions or site visits (depending on your objective).

Improved page layout

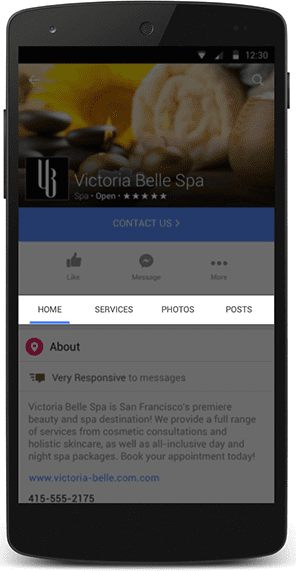
Among the headline-grabbing changes regarding adding virtual shops and big call to action buttons, this update has also re-jigged the layout of Facebook pages on mobile to make them easier to navigate. The design involves breaking down the page into various tabs, so that it is not overly long and requires a lot of scrolling.

Facebook business pages mobile layout

The option to message the page will appear prominently in the centre and above the tab menu, so make sure to have resource in place to have these questions answered swiftly; Facebook rewards pages which answer over 90% of messages within 5 minutes with a ‘Very responsive’ badge. When viewed on mobile, the page will default to the home tab, which starts with your pages ‘short description’ which can be found in the about section if looking on desktop. So make sure this is up to date and optimised to get the results you want.


source http://www.smartinsights.com/social-media-marketing/facebook-marketing/facebook-upgrades-mobile-pages-adding-storefronts-for-businesses-smartinsights-alert/