The best email statistics sources to benchmark open and clickthrough rates for your email campaigns in the UK
Email marketers often ask "how do our campaigns compare"? They're looking for statistics to compare subscriber engagement for open, clickthrough and delivery rates, ideally within their sector.
Fortunately, there are a number of good options to benchmark email response across different sectors. The best stats sources are compilations by email marketing service providers who produce statistics across their clients' campaigns. We have ordered them into the 4 top questions asked:
- What are the email engagement rates for small to medium businesses?
- What are the Email engagement rates for larger businesses?
- What is the breakdown of market share for email clients on mobile and desktop?
- What is a good open rate? And what is a good click through rate for email?
As we'll see, for the most meaningful comparisons we need to go beyond industry averages and drill down to the comparison of email types since transactional emails such as a welcome sequence tend to have much higher interaction and click-through rates than a regular newsletter.
Email Statistics - 2017 update
Q1. What are the email engagement rates for small to medium businesses?
We will continue to update this resource through the year as new reports are produced by the main email platforms. Do contact us if you're an email provider with new stats to share. Talking of which... Mailchimp has monthly updates of their Email benchmark stats which give a great source of comparing email response by industry. This Email response data has been updated on 1st February 2017.
| Open | Open rate (%) | Clickthrough rate (%) | Soft Bounce | Hard Bounce | Abuse | Unsub |
|---|---|---|---|---|---|---|
| Agriculture and Food Services | 24.71% | 2.98% | 0.58% | 0.43% | 0.02% | 0.29% |
| Architecture and Construction | 24.78% | 2.90% | 1.50% | 1.08% | 0.03% | 0.36% |
| Arts and Artists | 27.23% | 2.85% | 0.61% | 0.44% | 0.02% | 0.29% |
| Beauty and Personal Care | 18.48% | 1.96% | 0.38% | 0.38% | 0.03% | 0.32% |
| Business and Finance | 20.97% | 2.73% | 0.66% | 0.55% | 0.02% | 0.23% |
| Computers and Electronics | 20.87% | 2.16% | 1.02% | 0.70% | 0.02% | 0.31% |
| Construction | 22.10% | 1.95% | 1.56% | 1.20% | 0.04% | 0.43% |
| Consulting | 19.54% | 2.26% | 0.92% | 0.71% | 0.02% | 0.29% |
| Creative Services/Agency | 22.41% | 2.61% | 1.09% | 0.89% | 0.02% | 0.38% |
| Daily Deals/E-Coupons | 15.22% | 2.39% | 0.10% | 0.07% | 0.01% | 0.10% |
| E-commerce | 16.75% | 2.32% | 0.30% | 0.24% | 0.02% | 0.23% |
| Education and Training | 22.00% | 2.63% | 0.55% | 0.46% | 0.02% | 0.20% |
| Entertainment and Events | 21.21% | 2.33% | 0.49% | 0.41% | 0.02% | 0.28% |
| Gambling | 18.75% | 3.35% | 0.39% | 0.46% | 0.03% | 0.17% |
| Games | 20.82% | 3.33% | 0.44% | 0.50% | 0.02% | 0.25% |
| Government | 26.33% | 3.62% | 0.48% | 0.39% | 0.01% | 0.13% |
| Health and Fitness | 21.93% | 2.57% | 0.43% | 0.44% | 0.03% | 0.39% |
| Hobbies | 28.46% | 5.13% | 0.31% | 0.24% | 0.02% | 0.23% |
| Home and Garden | 23.82% | 3.47% | 0.57% | 0.40% | 0.03% | 0.37% |
| Insurance | 21.56% | 2.11% | 0.76% | 0.82% | 0.03% | 0.26% |
| Legal | 22.49% | 2.99% | 0.76% | 0.67% | 0.02% | 0.23% |
| Manufacturing | 21.74% | 2.33% | 1.41% | 0.99% | 0.03% | 0.36% |
| Marketing and Advertising | 17.81% | 1.92% | 0.77% | 0.61% | 0.02% | 0.28% |
| Media and Publishing | 22.14% | 4.70% | 0.28% | 0.18% | 0.01% | 0.12% |
| Medical, Dental, and Healthcare | 22.43% | 2.42% | 0.72% | 0.72% | 0.03% | 0.30% |
| Mobile | 19.43% | 2.10% | 0.57% | 0.63% | 0.02% | 0.36% |
| Music and Musicians | 22.86% | 2.84% | 0.56% | 0.42% | 0.02% | 0.29% |
| Non-Profit | 24.98% | 2.76% | 0.49% | 0.40% | 0.02% | 0.19% |
| Other | 23.06% | 2.81% | 0.78% | 0.60% | 0.02% | 0.28% |
| Pharmaceuticals | 20.02% | 2.51% | 0.79% | 0.74% | 0.02% | 0.22% |
| Photo and Video | 25.36% | 3.49% | 0.71% | 0.61% | 0.02% | 0.40% |
| Politics | 22.23% | 2.17% | 0.42% | 0.38% | 0.03% | 0.21% |
| Professional Services | 20.89% | 2.47% | 0.92% | 0.72% | 0.02% | 0.31% |
| Public Relations | 20.12% | 1.64% | 0.80% | 0.60% | 0.01% | 0.21% |
| Real Estate | 20.84% | 1.91% | 0.61% | 0.51% | 0.03% | 0.31% |
| Recruitment and Staffing | 20.73% | 2.18% | 0.53% | 0.60% | 0.02% | 0.32% |
| Religion | 26.46% | 3.11% | 0.19% | 0.17% | 0.01% | 0.13% |
| Restaurant | 21.17% | 1.25% | 0.24% | 0.22% | 0.02% | 0.26% |
| Restaurant and Venue | 21.71% | 1.33% | 0.53% | 0.45% | 0.02% | 0.42% |
| Retail | 20.96% | 2.50% | 0.35% | 0.30% | 0.02% | 0.28% |
| Social Networks and Online Communities | 21.71% | 3.33% | 0.37% | 0.29% | 0.02% | 0.23% |
| Software and Web App | 20.95% | 2.29% | 1.06% | 0.85% | 0.02% | 0.39% |
| Sports | 25.41% | 3.19% | 0.46% | 0.41% | 0.02% | 0.29% |
| Telecommunications | 21.57% | 2.43% | 1.13% | 0.92% | 0.02% | 0.27% |
| Travel and Transportation | 20.69% | 2.17% | 0.65% | 0.48% | 0.02% | 0.24% |
| Vitamin Supplements | 17.26% | 1.80% | 0.28% | 0.22% | 0.03% | 0.25% |
We do have other industry sector breakdowns of response later in this post, but since Mailchimp send billions of emails a month for more than 10 million users this is probably the largest global sample of email response that has been created. It is skewed to smaller businesses using their free account options, though.
Q2. What are the Email engagement rates for larger businesses?
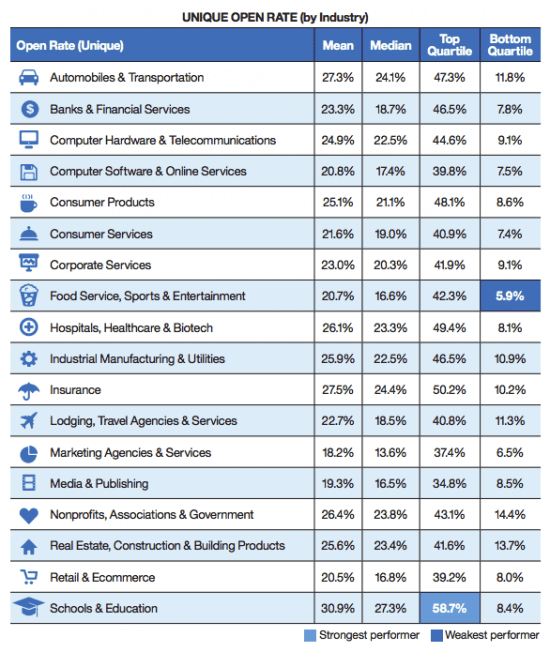
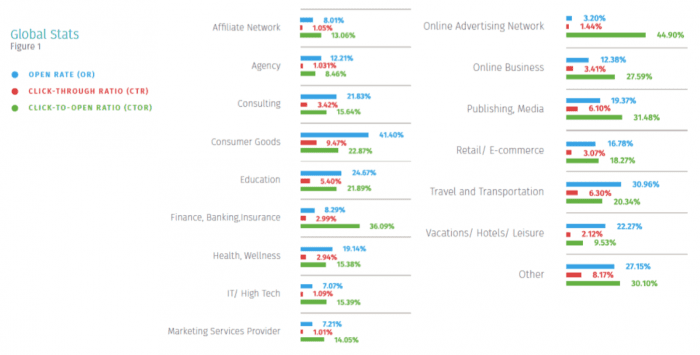
The results for Mailchimp are more typical of smaller and mid-size businesses, rather than large brands. This 2016 email benchmark compilation from Silverpop who are now owned by IBM so clients tend to represent larger businesses - they are from 750 companies representing 3,000 brands in 40 countries. So breakdowns by EMEA, UK, US and APAC are available too. I've selected the breakdown by industry which is more useful to compare your performance with.
But what is the average email open rate? Here are the open rates with the mean showing the variation from the poorest performing sectors like publishing and tech to consumer brands and non-profits.
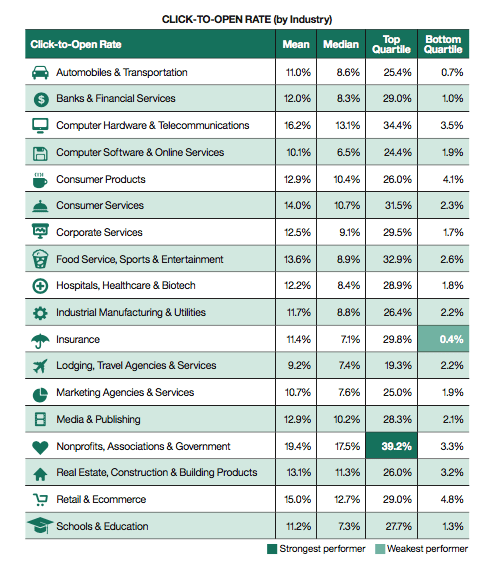
Rather than click-through rates that are also available in the report, I have picked out Click-to-open which shows engagement with the copy and creative. As a rule of thumb you should look for 10 to 15% CTOR, so can compare emails against this benchmark.
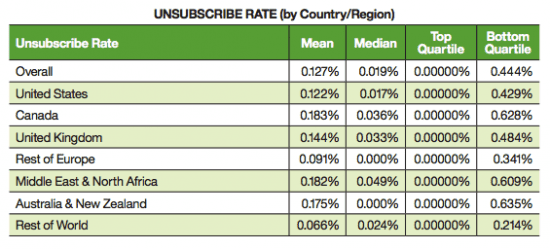
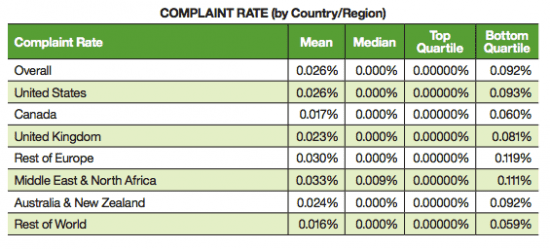
Finally, from this benchmark, I thought it would be useful to share the data on list churn as indicated by hard bounce rates and spam complaint rates. You don't want to go too high on these since you could have a problem with inbox delivery and likely your ESP will get in touch.
Q3. What is the breakdown of market share for email clients on mobile and desktop?
Litmus, one of the best sources for stats on Email marketing has produced a Jan 2015 update reviewing the current situation to previous years.
This chart summarising their research. While mobile remained dominant, this year did see some changes for mobile, webmail, and desktop.
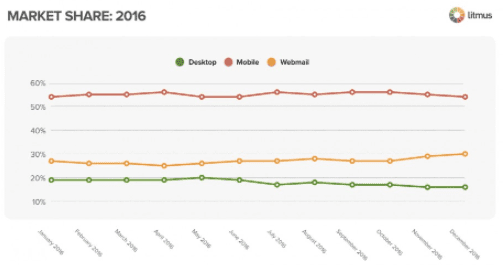
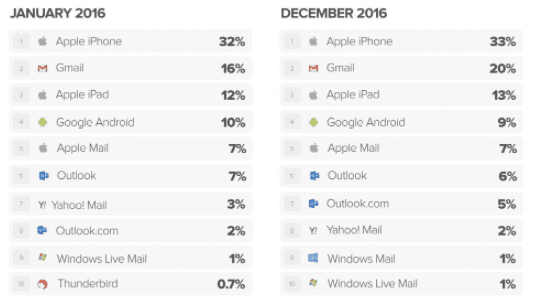
The latest Litmus compilation of email client market share from January 2017 shows why it's so important to consider how well your emails render on mobile. It's based on the percentage of opens on different platforms. The uptick in webmail opens is again largely due to Gmail defaulting to open images.
View post on % reading emails on mobile devices.
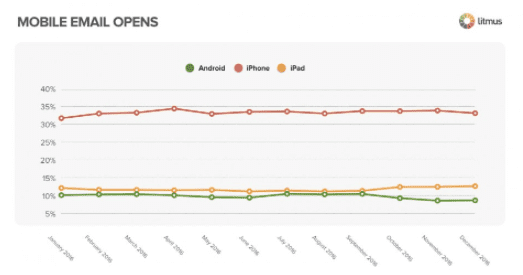
Litmus also has additional data aggregating Mobile clients - see their Email marketing client market share site for the latest updates. This shows the need to optimise for the iOS and Android platforms, bit with Android surprisingly low compared to the iPhone.
Q4. What is a good open rate? And what is a good click through rate for email?
Across all industries, the average open and clickthrough rate results according to the most recent Sign-up.To Email statistics for UK SME email marketing campaigns were:
Across all industries the average results for UK SME email marketing campaigns were:
- Open rate: 24.79% (2016: 24.88%)
- Click-through rate: 4.19% (3.42%)
- Unsubscription rate: 0.49% (0.52%)
- Click-to-open rate: 11.88% (10.88%)
- Unsubscribe-to-open rate: 2.59% (2.72%)
This data shows that open rate has had a slight decrease, click-through and click-to-open rates have slightly increased. While unsubscribe-to-open rates showed a slight decrease.
The 2017 report has a relatively small sample of 1.5 billion emails sent by SMBs during 2016.
But it's a useful report since it has the breakdown of opens, clicks and unsubscribes by industry for B2B and B2C markets. This shows the much lower response in some sectors such as Events, Education and Legal services.
There are also statistics on engagement measured as clicked to open - this info isn't always available in these types of benchmarks. It's useful to compare how effective your creative and offers is at to generating clickthroughs.
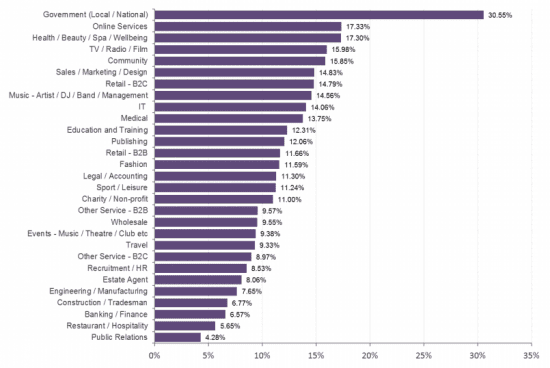
Finally, the full report also has a sector breakdown on unsubscribe rates. Again a large difference here by sector.
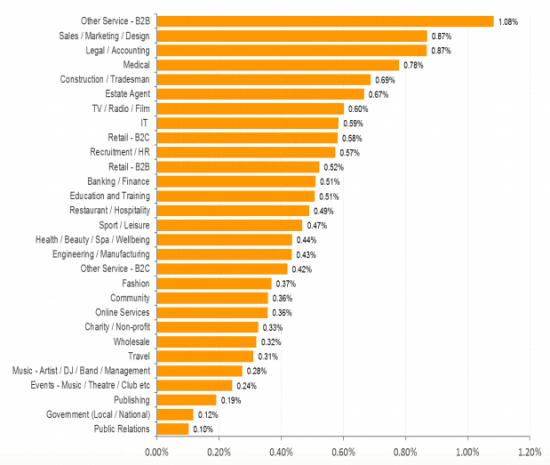
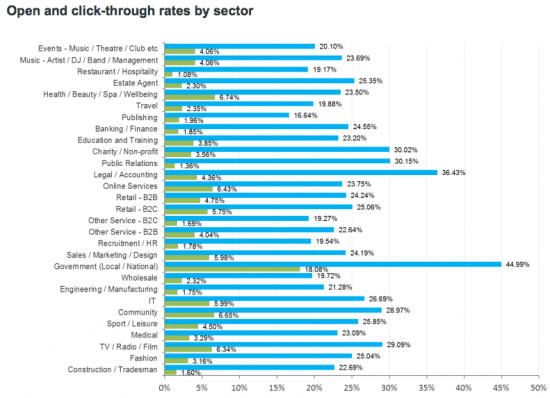
In the Autumn of 2015, we partnered with Email marketing platform GetResponse to benchmark adoption of email marketing techniques. As part of this project, GetResponse has now published one of the first benchmarks comparing email open and clickthrough rates by industry sector. The chart shows that email marketing is considerably more challenging in some sectors such as retail and e-commerce, marketing services and travel compared to others such as financial services and consumer sectors.
You can download the full State of Email marketing 2016 by industry from the GetResponse site - the 2017 update will be released by April 2017.
Please let us know of other sources we can share in updates here. Thanks!
source http://www.smartinsights.com/email-marketing/email-communications-strategy/statistics-sources-for-email-marketing/
No comments:
Post a Comment